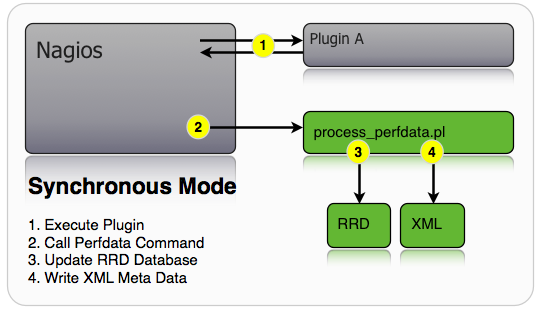
ConfigurationThe configuration of the already mentioned modes of performance data processing will be described in more detail. Synchronous Mode
Initially you have to enable processing of performance data in process_performance_data=1 Data processing has to be disabled in the definition of every host or service whose performance data should NOT be processed.
define service {
   ...
   process_perf_data 0
   ...
}
Since Nagios 3.x it is possible to deactivate the export of environment variables (as part of optimizing the system for maximum performance). Unfortunately this directive has to be enabled to use the synchronous mode. So either you use the default value (which means that the export is enabled) or you define the variable in enable_environment_macros=1
Additionally the command to process performance data is to be specified in service_perfdata_command=process-service-perfdata Starting with Nagios 3.0 it may be useful to enable processing of performance data for hosts as well. Due to changed host check logic Nagios 3 now performs regularly scheduled host checks. host_perfdata_command=process-host-perfdata Nagios has to be notified about the referenced commands as well. If you used the quickstart installation guides for Nagios you can modify the definitions in commands.cfg. You can see that calling process_perfdata.pl doesn't require any arguments apart from specifing the option -d ( DATATYPE ) if you want to process performance data resulting from host checks.
define command {
       command_name    process-service-perfdata
       command_line    /usr/bin/perl /usr/local/pnp4nagios/libexec/process_perfdata.pl
}

define command {
       command_name    process-host-perfdata
       command_line    /usr/bin/perl /usr/local/pnp4nagios/libexec/process_perfdata.pl -d HOSTPERFDATA
}
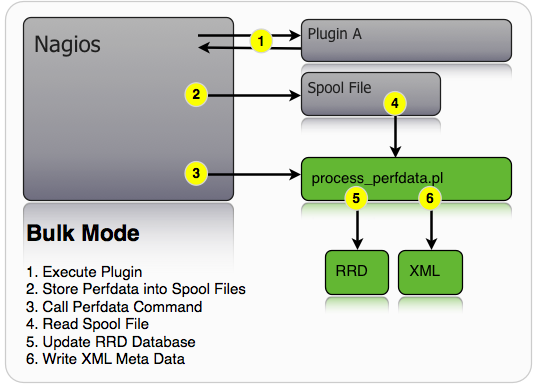
Note Bulk Mode
In bulk mode Nagios writes the data to a temporary file in a defined format. This file is processed by
Processing of performance data has to be enabled in process_performance_data=1 Additionally some new directives are required # # service performance data # service_perfdata_file=/usr/local/pnp4nagios/var/service-perfdata service_perfdata_file_template=DATATYPE::SERVICEPERFDATA\tTIMET::$TIMET$\tHOSTNAME::$HOSTNAME$\tSERVICEDESC::$SERVICEDESC$\tSERVICEPERFDATA::$SERVICEPERFDATA$\tSERVICECHECKCOMMAND::$SERVICECHECKCOMMAND$\tHOSTSTATE::$HOSTSTATE$\tHOSTSTATETYPE::$HOSTSTATETYPE$\tSERVICESTATE::$SERVICESTATE$\tSERVICESTATETYPE::$SERVICESTATETYPE$ service_perfdata_file_mode=a service_perfdata_file_processing_interval=15 service_perfdata_file_processing_command=process-service-perfdata-file # # host performance data starting with Nagios 3.0 # host_perfdata_file=/usr/local/pnp4nagios/var/host-perfdata host_perfdata_file_template=DATATYPE::HOSTPERFDATA\tTIMET::$TIMET$\tHOSTNAME::$HOSTNAME$\tHOSTPERFDATA::$HOSTPERFDATA$\tHOSTCHECKCOMMAND::$HOSTCHECKCOMMAND$\tHOSTSTATE::$HOSTSTATE$\tHOSTSTATETYPE::$HOSTSTATETYPE$ host_perfdata_file_mode=a host_perfdata_file_processing_interval=15 host_perfdata_file_processing_command=process-host-perfdata-file
Attention: Please note that these template definitions differ from the ones delivered in The directives and their meaning:
The used commands have to be announced to Nagios. If you used the quickstart installation guides for Nagios you can modify the definitions in commands.cfg.
define command{
       command_name    process-service-perfdata-file
       command_line    /usr/local/pnp4nagios/libexec/process_perfdata.pl --bulk=/usr/local/pnp4nagios/var/service-perfdata
}

define command{
       command_name    process-host-perfdata-file
       command_line    /usr/local/pnp4nagios/libexec/process_perfdata.pl --bulk=/usr/local/pnp4nagios/var/host-perfdata
}
NOTE:
Because there is more data to process than in synchronous mode
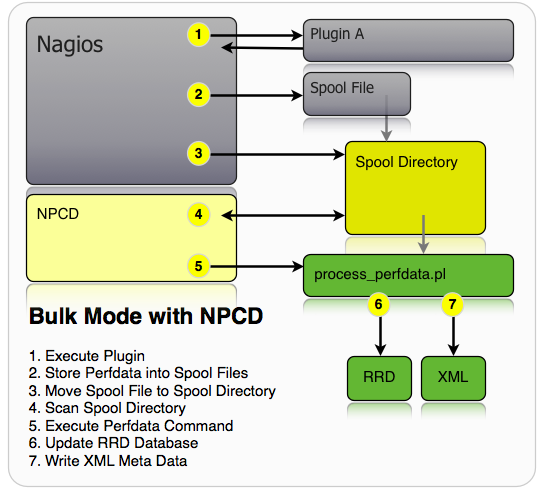
process_perfdata.pl will take longer to do this so you should check the TIMEOUT value in etc/process_perfdata.cfg and adjust it appropriately.Bulk Mode with NPCD
process_performance_data=1 Additionally some new directives are required # # service performance data # service_perfdata_file=/usr/local/pnp4nagios/var/service-perfdata service_perfdata_file_template=DATATYPE::SERVICEPERFDATA\tTIMET::$TIMET$\tHOSTNAME::$HOSTNAME$\tSERVICEDESC::$SERVICEDESC$\tSERVICEPERFDATA::$SERVICEPERFDATA$\tSERVICECHECKCOMMAND::$SERVICECHECKCOMMAND$\tHOSTSTATE::$HOSTSTATE$\tHOSTSTATETYPE::$HOSTSTATETYPE$\tSERVICESTATE::$SERVICESTATE$\tSERVICESTATETYPE::$SERVICESTATETYPE$ service_perfdata_file_mode=a service_perfdata_file_processing_interval=15 service_perfdata_file_processing_command=process-service-perfdata-file # # host performance data starting with Nagios 3.0 # host_perfdata_file=/usr/local/pnp4nagios/var/host-perfdata host_perfdata_file_template=DATATYPE::HOSTPERFDATA\tTIMET::$TIMET$\tHOSTNAME::$HOSTNAME$\tHOSTPERFDATA::$HOSTPERFDATA$\tHOSTCHECKCOMMAND::$HOSTCHECKCOMMAND$\tHOSTSTATE::$HOSTSTATE$\tHOSTSTATETYPE::$HOSTSTATETYPE$ host_perfdata_file_mode=a host_perfdata_file_processing_interval=15 host_perfdata_file_processing_command=process-host-perfdata-file
Attention: Please note that these template definitions differ from the ones delivered in The directives and their meaning:
The used commands have to be announced to Nagios. If you used the quickstart installation guides for Nagios you can modify the definitions in commands.cfg.
define command{
       command_name    process-service-perfdata-file
       command_line    /bin/mv /usr/local/pnp4nagios/var/service-perfdata /usr/local/pnp4nagios/var/spool/service-perfdata.$TIMET$
}

define command{
       command_name    process-host-perfdata-file
       command_line    /bin/mv /usr/local/pnp4nagios/var/host-perfdata /usr/local/pnp4nagios/var/spool/host-perfdata.$TIMET$
}
Using these commands the file service-perfdata will be moved to var/spool/ after the interval specified in In the directory /usr/local/pnp4nagios/var/spool/ files are gathered to be processed by NPCD.
NPCD monitors the spool directory and passes the file names to
Before starting NPCD you have to check the paths to the spool directory and to /usr/local/pnp4nagios/bin/npcd -d -f /usr/local/pnp4nagios/etc/npcd.cfg
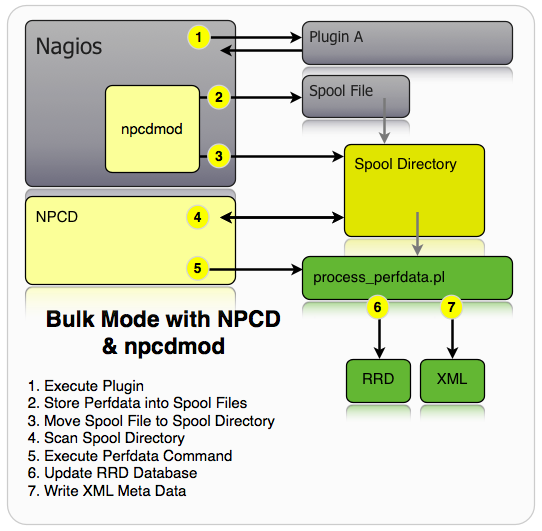
The option Bulk Mode with NPCD and npcdmodAttention Starting with Nagios 4 the internal structures have changed so the start of the module will fail. So far there are no plans to support Nagios 4. Please select any other of the modes.
Pro:
Adjustments in nagios.cfg: process_performance_data=1 broker_module=/usr/local/pnp4nagios/lib/npcdmod.o config_file=/usr/local/pnp4nagios/etc/npcd.cfg All other directives mentioned on this page must NOT be used.
Attention: If you have changed the value of After restarting Nagios information regarding the start of the module will be logged. Excerpt from nagios.log [1277545053] npcdmod: Copyright (c) 2008-2009 Hendrik Baecker (andurin@process-zero.de) - http://www.pnp4nagios.org [1277545053] npcdmod: /usr/local/pnp4nagios/etc/npcd.cfg initialized [1277545053] npcdmod: spool_dir = '/usr/local/pnp4nagios/var/spool/'. [1277545053] npcdmod: perfdata file '/usr/local/pnp4nagios/var/perfdata.dump'. [1277545053] npcdmod: Ready to run to have some fun! [1277545053] Event broker module '/usr/local/pnp4nagios/lib/npcdmod.o' initialized successfully. Gearman Mode
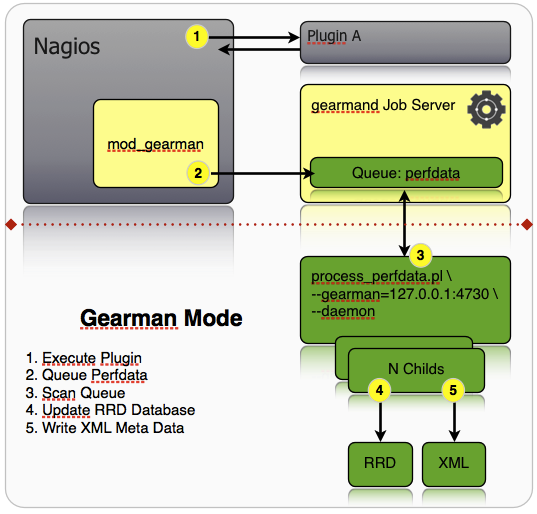
Since version 0.6.12 PNP4Nagios can be driven as a gearman worker. This way large Nagios environments are possible using mod_gearman. Nagios and PNP4Nagios can be run on different machines. You need a mod_gearman environment up and running like described by Sven Nierlein on http://labs.consol.de/lang/en/nagios/mod-gearman/.
You'll find a section on gearman in PREFORK = 1 GEARMAN_HOST = localhost:4730 REQUESTS_PER_CHILD = 10000 ENCRYPTION = 1 KEY = should_be_changed #KEY_FILE = /usr/local/pnp4nagios/etc/secret.key
Using
After starting the daemon process using /etc/init.d/pnp_gearmon_worker start the performance data will be processed which is provided by the gearmand daemon on the Nagios server. |


|