New in PNP 0.6.x
The work on the new version 0.6.x is in full progress. Starting with version 0.6.x we switch from subversion to GIT. The sourcecode is already available on sourceforge. Functions implemented already
About PNPSystem requirementsPNP mandatory requires valid performance data of nagios plugins. So what is this performance data? The output of a nagios plugin up to nagios 2.x is limited to one line. When the plugin produces performance data, it is divided into two parts. The pipe symbol (“|”) is used as a delimiter. Example check_icmp : OK - 127.0.0.1: rta 2.687ms, lost 0% | rta=2.687ms;3000.000;5000.000;0; pl=0%;80;100;; resulting in the text on the left side of the pipe symbol OK - 127.0.0.1: rta 2.687ms, lost 0% and the performance data rta=2.687ms;3000.000;5000.000;0; pl=0%;80;100;; Performance data is designed for automatic processing. The format is specified within the Developer Guidelines (you'll find an excerpt here) but should be exemplified here nonetheless: rta=2.687ms;3000.000;5000.000;0;
| | | | | | |
|----|--|----|---------|-----|-|----- * label
|--|----|---------|-----|-|----- * current value
|----|---------|-----|-|----- unit ( UOM = UNIT of Measurement )
|---------|-----|-|----- warning threshold
|-----|-|----- critical threshold
|-|----- minimum value
|----- maximum value
Value marked with * are mandatory. All other values are optional. Several data series are separated by blanks. The actual data must not contains any blanks. If the label contains blanks, it has to be surrounded by single quotes. Required Software
LicensePNP is licensed under GPL 2 DownloadDevelopment of PNP is organized using Sourceforge.Net. PNP is registered under “PNP4nagios”. The current stable version of 0.6.x can be found in the download area: Sourceforge Download Starting with PNP 0.6.x the source code repository was switched from SVN to GIT.
The current development can be viewed anytime at https://github.com/lingej/pnp4nagios. Clicking on pnp4nagios-head.tar.gz will download an archive containing the latest version.
Support
PRIOR to support questions please make sure that you have verified certain things described under verify your installation.
The developers and helpers are present on a separate board at http://www.monitoring-portal.org and will be informed about new postings in the PNP-section. Postings in english will be answered as well. The mailing lists on Sourceforge can be used to request support (and are limited to english): pnp4nagios-users: users list for general questions regarding configuration. Please state your operating system and PNP version pnp4nagios-devel: devel list for suggestions and error reports. Please state your operating system and PNP version pnp4nagios-checkins: the checkin list automatically contains changes to the SVN repository StoragePerformance data will be stored in Round Robin Databases using RRDtool. That means that after some time the oldest data will be dropped at the “end” and it will be replaced by new values “at the beginning”. Various intervals provide for different resolutions. Using the defaults allows to store the data with a resolution of one minute for the last two days, five minutes resolution for ten days, 30 minutes resolution for 90 days and 6 hours resolution for four years. The increasing interval causes averaging of the data which leads to smaller max values. This not an error of PNP. Using this storage format the size of the files will stay the same over time. Per datasource you will need approx. 400 KB. Statistics and links to Sourceforge
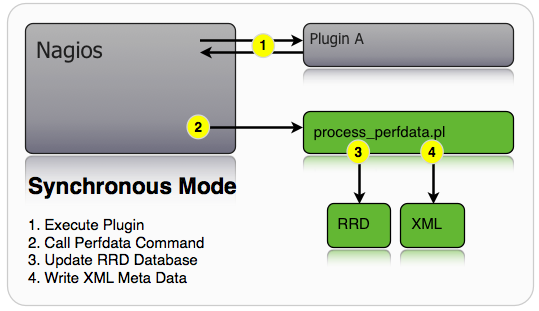
The art of collecting dataPNP supports several modes to process performance data. The modes differ in complexity and the performance to be expected.
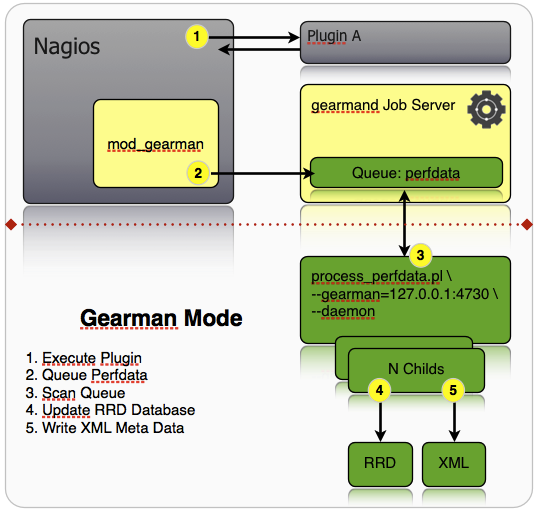
The following image shows the connections between Nagios, PNP and RRDtool
Nagios invokes a command for every host and every service whose performance data should be processed. Depending on the mode you choose the data will be passed to process_perfdata.pl or will be written to temporary files and processed at a later time. process_perfdata.pl writes the data to XML files and stores them in RRD files using RRDtool. Before you choose a mode please read the documentation and decide which way will be the best for installation. The modes in comparisonSynchronous Mode
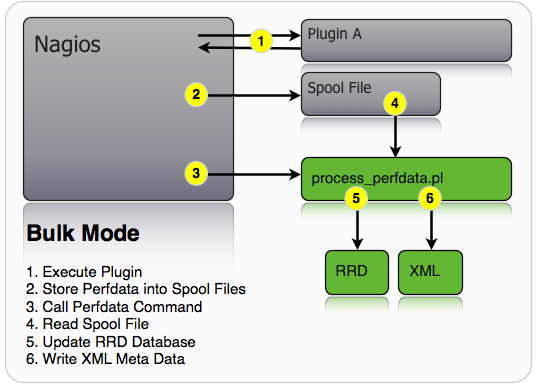
Bulk Mode
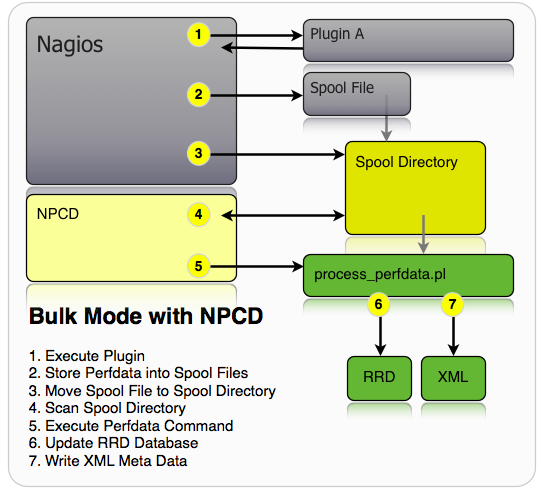
The number of calls of process_perfdata.pl will be reduced to a fraction. Depending on time and the amount of collected data there will be much less system calls. Instead, process_perfdata.pl will run longer. Note Using this mode you should keep an eye on the runtime of process_perfdata.pl. While it is running to process data nagios will not execute any checks. snippet of var/perfdata.log: 2007-10-18 12:05:01 [21138] 71 Lines processed 2007-10-18 12:05:01 [21138] .../spool/service-perfdata-1192701894-PID-21138 deleted 2007-10-18 12:05:01 [21138] PNP exiting (runtime 0.060969s) ... 71 lines were processed in 0.06 seconds. This will be the data volume of about 2000 services und processing using a 10 second interval. It means we blocked nagios for exactly 0.06 seconds. Bulk Mode with NPCD
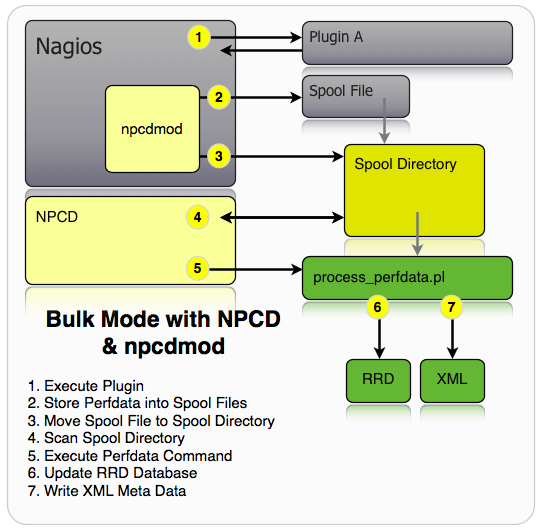
Nagios again uses a temporary file to store the data and executes a command after expiration of a certain time. Instead of immediate processing by process_perfdata.pl the file is moved to a spool directory. As moving a file inside the same filesystem nearly takes no time nagios is able to execute crucial work immediately. The NPCD daemon (Nagios Performance C Daemon) will monitor the directory for new files and will pass the names to process_perfdata.pl. Processing of performance data is decoupled completely from nagios. NPCD itself is able to start multiple thread for processing the data. Bulk Mode with npcdmodAttention Starting with Nagios 4 the internal structures have changed so the start of the module will fail. So far there are no plans to support Nagios 4. Please select any other of the modes.
This mode is similar to “Bulk Mode with NPCD” and it is exactly the same functionality and the same performance. Gearman Mode
Since version 0.6.12 PNP4Nagios can be driven as a gearman worker. This way large Nagios environments are possible using mod_gearman. Nagios and PNP4Nagios can be run on different machines. You need a mod_gearman environment up and running like described by Sven Nierlein on http://labs.consol.de/lang/en/nagios/mod-gearman/. The decisionWhich mode you choose will depend on the size of your Nagios installation. You will find theses terms throughout the documentation. PNP 0.6.x DownloadsCurrent stable PNP VersionChanges can be tracked on pnp4nagios.git.sourceforge.net The current Version is pnp4nagios-0.6.25.tar.gz Latest Devel VersionThis is allways the latest GIT HEAD Version Last Update: Sun Aug 20 19:30:01 CEST 2017 ChangeLogpnp-0.6.?? ??/??/2015 pnp-0.6.25 01/03/2015
pnp-0.6.24 07/30/2014
pnp-0.6.22 06/04/2014
pnp-0.6.21 03/24/2013
pnp-0.6.20 03/03/2013
pnp-0.6.19 09/01/2012
pnp-0.6.18 06/28/2012
pnp-0.6.17 03/25/2012
pnp-0.6.16 11/21/2011
pnp-0.6.15 09/15/2011
pnp-0.6.14 08/05/2011
pnp-0.6.13 05/19/2011
pnp-0.6.12 04/22/2011
pnp-0.6.11 01/15/2011
pnp-0.6.10 12/15/2010
pnp-0.6.7 09/27/2010
pnp-0.6.6 08/07/2010
pnp-0.6.5 07/09/2010
pnp-0.6.4 06/03/2010
pnp-0.6.3 03/16/2010
pnp-0.6.2 12/23/2009
pnp-0.6.1 11/22/2009
pnp-0.6.0 10/30/2009
Upgrade to version 0.6.xThe web-frontend has been completely rewritten and is now based on the PHP MVC framework Kohana. This leads to changed dependencies which must be checked prior to installation. Note: At first an upgrade is like a new installation. Afterwards some changes should be made which are described further down.
Without specifying any options during
Without specifying any options during Note: It is sufficient to copy the *.rrd files from the old to the new location. They contain the data The *.xml files are recreated every time new performance data arrives as they contain meta information. The internal structure of the xml files has changed so you wouldn't be able to use them either way. Comparison of the structureSummary of a PNP 0.4.14 installation ./configure ... *** Configuration summary for pnp 0.4.14 05-02-2009 *** General Options: ------------------------- ------------------- Nagios user/group: nagios nagios Install directory: /usr/local/nagios HTML Dir: /usr/local/nagios/share/pnp Config Dir: /usr/local/nagios/etc/pnp Location of rrdtool binary: /usr/bin/rrdtool Version 1.3.1 RRDs Perl Modules: FOUND (Version 1.3001) RRD Files stored in: /usr/local/nagios/share/perfdata process_perfdata.pl Logfile: /usr/local/nagios/var/perfdata.log Perfdata files (NPCD) stored in: /usr/local/nagios/var/spool/perfdata/ Summary of a PNP 0.6.0 installation ./configure ... *** Configuration summary for pnp4nagios-0.6.0 07-30-2009 *** General Options: ------------------------- ------------------- Nagios user/group: nagios nagios Install directory: /usr/local/pnp4nagios HTML Dir: /usr/local/pnp4nagios/share Config Dir: /usr/local/pnp4nagios/etc Location of rrdtool binary: /usr/bin/rrdtool Version 1.3.1 RRDs Perl Modules: FOUND (Version 1.3001) RRD Files stored in: /usr/local/pnp4nagios/var/perfdata process_perfdata.pl Logfile: /usr/local/pnp4nagios/var/perfdata.log Perfdata files (NPCD) stored in: /usr/local/pnp4nagios/var/spool Web Interface Options: ------------------------- ------------------- HTML URL: http://localhost/pnp4nagios/ Apache Config File: /etc/apache2/conf.d/pnp4nagios.conf Looking at these lines result in the parameters to be changed and the upgrade strategy. AdjustmentsThe templates of the action_url definitions have changed. Instead of ”/nagios/pnp” the URL should be ”/pnp4nagios” and instead of “index.php” now “graph” will be used. define host {
name host-pnp
register 0
action_url /pnp4nagios/graph?host=$HOSTNAME$
}
define service {
name srv-pnp
register 0
action_url /pnp4nagios/graph?host=$HOSTNAME$&srv=$SERVICEDESC$
}
The definitions for the preview popup function are similar define host {
name host-pnp
action_url /pnp4nagios/index.php/graph?host=$HOSTNAME$&srv=_HOST_' class='tips' rel='/pnp4nagios/index.php/popup?host=$HOSTNAME$&srv=_HOST_
register 0
}
define service {
name srv-pnp
action_url /pnp4nagios/graph?host=$HOSTNAME$&srv=$SERVICEDESC$' class='tips' rel='/pnp4nagios/popup?host=$HOSTNAME$&srv=$SERVICEDESC$
register 0
}
Attention: It is not an error that the strings in front and after “class” contain only one quote. Other than described in the 0.4.x documentation these templates can be used for Nagios 2.x and 3.x. The variables in the files in the templates folder have to be initialised before first use. Example $lower = "" Earlier you were able to append to variables which weren't initialised before first use. Example: foreach ($DS as $i) {
$def[1] .= "DEF:var$i=$rrdfile:$DS[$i]:AVERAGE " ;
Now you have to change that to
$def[1] = "";
foreach ($DS as $i) {
    $def[1] .= "DEF:var$i=$rrdfile:$DS[$i]:AVERAGE " ;
define("_WARNRULE", '#FFFF00');
may be changed to $WARNRULE = '#FFFF00';
Please keep in mind that all occurrences have to be changed Upgrade scenario using NPCD
Installation
The installation of PNP will be described in more detail. It is expected that nagios was compiled from source and is located in /usr/local/nagios. Make and moreThe installation of PNP is controlled by makefiles. The system is analyzed after invocation of ./configure and the detected values are tranferred to makefiles. Please unpack PNP as user root: tar -xvzf pnp4nagios-HEAD.tar.gz cd pnp4nagios ./configure is to be called from the directory pnp4nagios. ./configure Note: Without specifying any options user and group will be “nagios”. If you have different values then please use the parameters ”--with-nagios-user” and ”--with-nagios-group”, respectively. Using Icinga the call might be ./configure --with-nagios-user=icinga --with-nagios-group=icinga Some lines run across the screen. The output at the end is important. *** Configuration summary for pnp4nagios-0.6.2 23-12-2009 *** General Options: ------------------------- ------------------- Nagios user/group: nagios nagios Install directory: /usr/local/pnp4nagios HTML Dir: /usr/local/pnp4nagios/share Config Dir: /usr/local/pnp4nagios/etc Location of rrdtool binary: /usr/bin/rrdtool Version 1.2.12 RRDs Perl Modules: FOUND (Version 1.2012) RRD Files stored in: /usr/local/pnp4nagios/var/perfdata process_perfdata.pl Logfile: /usr/local/pnp4nagios/var/perfdata.log Perfdata files (NPCD) stored in: /usr/local/pnp4nagios/var/spool Web Interface Options: ------------------------- ------------------- HTML URL: http://localhost/pnp4nagios/ Apache Config File: /etc/apache2/conf.d/pnp4nagios.conf Review the options above for accuracy. If they look okay, type 'make all' to compile.
The paths shown should be checked. If the displayed values aren't correct you can change them calling ./configure with appropriate options. ./configure --with-rrdtool=/usr/local/rrdtool-1.2.xx/bin/rrdtool ./configure --help
shows the supported options. Invoking make all compiles the components like NPCD which are written in C make install copies everything to the right places in the file system. The paths were already shows during ./configure. After the installation of the program and HTML files you can copy a sample Apache configuration file to your web-server config directory make install-webconf You can call make install-config optionally. This way config files for process_perfdata.pl and npcd are copied to etc/pnp. To install the NPCD Init script call make install-init All these steps are combined in make fullinstall Note: As already stated the Nagios settings will be used per default. If you are using Icinga the file '/etc/apache2/conf.d/pnp4nagios.conf' has to be edited to change the path to AuthUserFile (the path may differ between distributions): # AuthUserFile /usr/local/nagios/etc/htpasswd.users
AuthUserFile /usr/local/icinga/etc/htpasswd.users
Attention: After copying the configuration file for the web server you have to restart the web server ( Update
The update of a 0.6.x version works (nearly) the same way as an installation. Please note that you have to call
You can skip The componentsAfter installation the components of PNP were copied to the appropriate places in the file system. These are the PHP-Files for the web-frontend below /usr/local/pnp4nagios/share the data collector process_perfdata.pl in /usr/local/pnp4nagios/libexec
sample config files with the suffix /usr/local/pnpnagios/etc the config file config.php for the web frontend in /usr/local/pnp4nagios/etc ConfigurationThe configuration of the already mentioned modes of performance data processing will be described in more detail. Synchronous Mode
Initially you have to enable processing of performance data in process_performance_data=1 Data processing has to be disabled in the definition of every host or service whose performance data should NOT be processed.
define service {
   ...
   process_perf_data 0
   ...
}
Since Nagios 3.x it is possible to deactivate the export of environment variables (as part of optimizing the system for maximum performance). Unfortunately this directive has to be enabled to use the synchronous mode. So either you use the default value (which means that the export is enabled) or you define the variable in enable_environment_macros=1
Additionally the command to process performance data is to be specified in service_perfdata_command=process-service-perfdata Starting with Nagios 3.0 it may be useful to enable processing of performance data for hosts as well. Due to changed host check logic Nagios 3 now performs regularly scheduled host checks. host_perfdata_command=process-host-perfdata Nagios has to be notified about the referenced commands as well. If you used the quickstart installation guides for Nagios you can modify the definitions in commands.cfg. You can see that calling process_perfdata.pl doesn't require any arguments apart from specifing the option -d ( DATATYPE ) if you want to process performance data resulting from host checks.
define command {
       command_name    process-service-perfdata
       command_line    /usr/bin/perl /usr/local/pnp4nagios/libexec/process_perfdata.pl
}

define command {
       command_name    process-host-perfdata
       command_line    /usr/bin/perl /usr/local/pnp4nagios/libexec/process_perfdata.pl -d HOSTPERFDATA
}
Note Bulk Mode
In bulk mode Nagios writes the data to a temporary file in a defined format. This file is processed by
Processing of performance data has to be enabled in process_performance_data=1 Additionally some new directives are required # # service performance data # service_perfdata_file=/usr/local/pnp4nagios/var/service-perfdata service_perfdata_file_template=DATATYPE::SERVICEPERFDATA\tTIMET::$TIMET$\tHOSTNAME::$HOSTNAME$\tSERVICEDESC::$SERVICEDESC$\tSERVICEPERFDATA::$SERVICEPERFDATA$\tSERVICECHECKCOMMAND::$SERVICECHECKCOMMAND$\tHOSTSTATE::$HOSTSTATE$\tHOSTSTATETYPE::$HOSTSTATETYPE$\tSERVICESTATE::$SERVICESTATE$\tSERVICESTATETYPE::$SERVICESTATETYPE$ service_perfdata_file_mode=a service_perfdata_file_processing_interval=15 service_perfdata_file_processing_command=process-service-perfdata-file # # host performance data starting with Nagios 3.0 # host_perfdata_file=/usr/local/pnp4nagios/var/host-perfdata host_perfdata_file_template=DATATYPE::HOSTPERFDATA\tTIMET::$TIMET$\tHOSTNAME::$HOSTNAME$\tHOSTPERFDATA::$HOSTPERFDATA$\tHOSTCHECKCOMMAND::$HOSTCHECKCOMMAND$\tHOSTSTATE::$HOSTSTATE$\tHOSTSTATETYPE::$HOSTSTATETYPE$ host_perfdata_file_mode=a host_perfdata_file_processing_interval=15 host_perfdata_file_processing_command=process-host-perfdata-file
Attention: Please note that these template definitions differ from the ones delivered in The directives and their meaning:
The used commands have to be announced to Nagios. If you used the quickstart installation guides for Nagios you can modify the definitions in commands.cfg.
define command{
       command_name    process-service-perfdata-file
       command_line    /usr/local/pnp4nagios/libexec/process_perfdata.pl --bulk=/usr/local/pnp4nagios/var/service-perfdata
}

define command{
       command_name    process-host-perfdata-file
       command_line    /usr/local/pnp4nagios/libexec/process_perfdata.pl --bulk=/usr/local/pnp4nagios/var/host-perfdata
}
NOTE:
Because there is more data to process than in synchronous mode
process_perfdata.pl will take longer to do this so you should check the TIMEOUT value in etc/process_perfdata.cfg and adjust it appropriately.Bulk Mode with NPCD
process_performance_data=1 Additionally some new directives are required # # service performance data # service_perfdata_file=/usr/local/pnp4nagios/var/service-perfdata service_perfdata_file_template=DATATYPE::SERVICEPERFDATA\tTIMET::$TIMET$\tHOSTNAME::$HOSTNAME$\tSERVICEDESC::$SERVICEDESC$\tSERVICEPERFDATA::$SERVICEPERFDATA$\tSERVICECHECKCOMMAND::$SERVICECHECKCOMMAND$\tHOSTSTATE::$HOSTSTATE$\tHOSTSTATETYPE::$HOSTSTATETYPE$\tSERVICESTATE::$SERVICESTATE$\tSERVICESTATETYPE::$SERVICESTATETYPE$ service_perfdata_file_mode=a service_perfdata_file_processing_interval=15 service_perfdata_file_processing_command=process-service-perfdata-file # # host performance data starting with Nagios 3.0 # host_perfdata_file=/usr/local/pnp4nagios/var/host-perfdata host_perfdata_file_template=DATATYPE::HOSTPERFDATA\tTIMET::$TIMET$\tHOSTNAME::$HOSTNAME$\tHOSTPERFDATA::$HOSTPERFDATA$\tHOSTCHECKCOMMAND::$HOSTCHECKCOMMAND$\tHOSTSTATE::$HOSTSTATE$\tHOSTSTATETYPE::$HOSTSTATETYPE$ host_perfdata_file_mode=a host_perfdata_file_processing_interval=15 host_perfdata_file_processing_command=process-host-perfdata-file
Attention: Please note that these template definitions differ from the ones delivered in The directives and their meaning:
The used commands have to be announced to Nagios. If you used the quickstart installation guides for Nagios you can modify the definitions in commands.cfg.
define command{
       command_name    process-service-perfdata-file
       command_line    /bin/mv /usr/local/pnp4nagios/var/service-perfdata /usr/local/pnp4nagios/var/spool/service-perfdata.$TIMET$
}

define command{
       command_name    process-host-perfdata-file
       command_line    /bin/mv /usr/local/pnp4nagios/var/host-perfdata /usr/local/pnp4nagios/var/spool/host-perfdata.$TIMET$
}
Using these commands the file service-perfdata will be moved to var/spool/ after the interval specified in In the directory /usr/local/pnp4nagios/var/spool/ files are gathered to be processed by NPCD.
NPCD monitors the spool directory and passes the file names to
Before starting NPCD you have to check the paths to the spool directory and to /usr/local/pnp4nagios/bin/npcd -d -f /usr/local/pnp4nagios/etc/npcd.cfg
The option Bulk Mode with NPCD and npcdmodAttention Starting with Nagios 4 the internal structures have changed so the start of the module will fail. So far there are no plans to support Nagios 4. Please select any other of the modes.
Pro:
Adjustments in nagios.cfg: process_performance_data=1 broker_module=/usr/local/pnp4nagios/lib/npcdmod.o config_file=/usr/local/pnp4nagios/etc/npcd.cfg All other directives mentioned on this page must NOT be used.
Attention: If you have changed the value of After restarting Nagios information regarding the start of the module will be logged. Excerpt from nagios.log [1277545053] npcdmod: Copyright (c) 2008-2009 Hendrik Baecker (andurin@process-zero.de) - http://www.pnp4nagios.org [1277545053] npcdmod: /usr/local/pnp4nagios/etc/npcd.cfg initialized [1277545053] npcdmod: spool_dir = '/usr/local/pnp4nagios/var/spool/'. [1277545053] npcdmod: perfdata file '/usr/local/pnp4nagios/var/perfdata.dump'. [1277545053] npcdmod: Ready to run to have some fun! [1277545053] Event broker module '/usr/local/pnp4nagios/lib/npcdmod.o' initialized successfully. Gearman Mode
Since version 0.6.12 PNP4Nagios can be driven as a gearman worker. This way large Nagios environments are possible using mod_gearman. Nagios and PNP4Nagios can be run on different machines. You need a mod_gearman environment up and running like described by Sven Nierlein on http://labs.consol.de/lang/en/nagios/mod-gearman/.
You'll find a section on gearman in PREFORK = 1 GEARMAN_HOST = localhost:4730 REQUESTS_PER_CHILD = 10000 ENCRYPTION = 1 KEY = should_be_changed #KEY_FILE = /usr/local/pnp4nagios/etc/secret.key
Using
After starting the daemon process using /etc/init.d/pnp_gearmon_worker start the performance data will be processed which is provided by the gearmand daemon on the Nagios server. Checking the installation
If everything went well until now you can try to call PNP using your web browser.
When using the installation with default values PNP should be called using http://<server name>/pnp4nagios/.
The first time you will see a page “PNP4Nagios Environment Tests” which includes different checks of necessary components. Obviously all checks have to be passed successfully before you can proceed. Please follow the instructions given on that page. If all tests have passed *successfully* the file pnp4nagios/share/install.php can be deleted or renamed. Not till then the web interface is reachable.
Alternatively you can create a file called
If you receive the message “PHP magic_quotes_gpc is deprecated” then please locate your Called without any arguments PNP looks for RRD and XML files in pnp4nagios/var/perfdata and shows all graphs of the first host. ATTENTION: Immediately after (re-)starting Nagios after you enabled the processing of performance data you will get error messages in your browser because performance data has to be collected and stored in RRD files. Depending on the check interval you are using you have to wait some time before you can view the first graphs. Debug Logfile
Calling
The most important options launching PNP are LOG_LEVEL and LOG_FILE. We recommend setting the During normal operation the debug level should be set to 0 to avoid performance issues due to unnecessary entries in the log file. Something went wrongSome basic settings should be checked
1. Have any RRD and XML files been created?
2. Has nagios called 3. Graphs are shown without text? Have a look at the requirements.
4. Some graphs are shown, others report the error
5. Using the npcdmod module the value of the nagios.cfg directive 6. You can use the script verify_pnp_config.pl after installation to check your settings and if performance data is present. 7. Things look OK, but some files are being left in the spool directory (/usr/local/pnp4nagios/var/spool/<perfdata_filename>-PID-<process_perfdata_pid>). If process_perdata.pl is not able to write to the destination directory (/usr/local/pnp4nagios/share/perfdata/<host>), it will stop and not remove the file. That will increase the size of the spool directory and slow down performance data processing. This problem is likely to occur if you have copied directories from a previous installation and/or manually created directories and left them with wrong permissions or wrong ownership. verify_pnp_config
In case of problems there is a script called * ATTENTION *: It ONLY supports verifying Nagios 3.x and Icinga 1.x as Monitoring core. Downloadwget http://verify.pnp4nagios.org/verify_pnp_config TestThe verify script is located on http://verify.pnp4nagios.org and needs three start options
Calling The following is a sample run lenny:~# perl verify_pnp_config --mode npcdmod --config=/usr/local/nagios/etc/nagios.cfg --pnpcfg=/usr/local/pnp4nagios/etc [INFO] ========== Starting Environment Checks ============ [INFO] My version is: verify_pnp_config-0.6.14-R.31 [INFO] Reading /usr/local/nagios/etc/nagios.cfg [OK ] Running product is 'nagios' [OK ] object_cache_file is defined [OK ] object_cache_file=/usr/local/nagios/var/objects.cache [INFO] Reading /usr/local/nagios/var/objects.cache [OK ] resource_file is defined [OK ] resource_file=/usr/local/nagios/etc/resource.cfg [INFO] Reading /usr/local/nagios/etc/resource.cfg [INFO] Reading /usr/local/pnp4nagios/etc/process_perfdata.cfg [INFO] Reading /usr/local/pnp4nagios/etc/pnp4nagios_release [OK ] Found PNP4Nagios version "0.6.14" [OK ] Effective User is 'nagios' [OK ] User nagios exists with ID '1000' [OK ] Effective group is 'nagios' [OK ] Group nagios exists with ID '1000' [INFO] ========== Checking npcdmod Mode Config ============ [OK ] process_performance_data is 1 compared with '/1/' [OK ] event_broker_options is defined [OK ] event_broker_options=-1 [OK ] event_broker_option bits 2 and 3 enabled (12) [OK ] broker_module is defined [OK ] broker_module=/usr/local/pnp4nagios/lib/npcdmod.o config_file=/usr/local/pnp4nagios/etc/npcd.cfg [OK ] npcdmod.o config file is /usr/local/pnp4nagios/etc/npcd.cfg [OK ] /usr/local/pnp4nagios/etc/npcd.cfg used by npcdmod.o is readable [OK ] npcd daemon is running [OK ] /usr/local/pnp4nagios/etc/npcd.cfg is used by npcd and readable [OK ] npcd and npcdmod.o are using the same config file (/usr/local/pnp4nagios/etc/npcd.cfg) [INFO] Nagios config looks good so far [INFO] ========== Checking config values ============ [INFO] Reading /usr/local/pnp4nagios/etc/npcd.cfg [OK ] Script /usr/local/pnp4nagios/libexec/process_perfdata.pl is executable [INFO] ========== Starting global checks ============ [OK ] status_file is defined [OK ] status_file=/dev/shm/status.dat [INFO] Reading /dev/shm/status.dat [INFO] ==== Starting rrdtool checks ==== [OK ] RRDTOOL is defined [OK ] RRDTOOL=/usr/bin/rrdtool [OK ] /usr/bin/rrdtool is executable [OK ] RRDtool 1.3.1 Copyright 1997-2008 by Tobias Oetiker <tobi@oetiker.ch> [OK ] USE_RRDs is defined [OK ] USE_RRDs=1 [OK ] Perl RRDs modules are loadable [INFO] ==== Starting directory checks ==== [OK ] RRDPATH is defined [OK ] RRDPATH=/usr/local/pnp4nagios/var/perfdata [OK ] Perfdata directory '/usr/local/pnp4nagios/var/perfdata' exists [WARN] 62 hosts/services are not providing performance data [WARN] 'process_perf_data 1' is set for 43 hosts/services which are not providing performance data! [WARN] 'process_perf_data 0' is set for 27 of your hosts/services [OK ] 'process_perf_data 1' is set for 243 of your hosts/services [INFO] ==== System sizing ==== [OK ] 269 hosts/service objects defined [INFO] ==== Check statistics ==== [WARN] Warning: 3, Critical: 0 [WARN] Checks finished... Performance data
Starting with
The strings are taken as regular expressions (perl syntax). Nagios web frontendOf course PNP should be easily accessible. You do not want to search long for the right graph. Nagios itself features external URLs using so called extended info configs. Due to changes between Nagios 2.x and Nagios 3.x both versions are described. Nagios 2.xWith Nagios 2.x the integration of external URLs into the nagios web interface is made using Extended Info Objects for services. For PNP we use the directive action_url to call the PNP web frontend with the appropriate options.
define serviceextinfo {
   host_name             localhost
   service_description   load
   action_url            /pnp4nagios/index.php/graph?host=$HOSTNAME$&srv=$SERVICEDESC$
}
You have to specify an additional Extended Info Definition for every service. Nagios 3.xSince nagios 3.0 the action_url-directive has be moved to the host or service definition. This way the definition of URLs to the PNP-interface has been simplified. The serviceextinfo and hostextinfo definitions are deprecated. First two nagios templates are defined. If you used the Nagios quickstart installation guides you can append these lines to templates.cfg:
define host {
   name       host-pnp
   action_url /pnp4nagios/index.php/graph?host=$HOSTNAME$&srv=_HOST_
   register   0
}

define service {
   name       srv-pnp
   action_url /pnp4nagios/index.php/graph?host=$HOSTNAME$&srv=$SERVICEDESC$
   register   0
}
These two templates can now be included via “use srv-pnp” or “use host-pnp” for services and hosts respectively. If you used the quickstart installation guide you might for example edit the file localhost.cfg and add the template to the host or service definition as follows: define host{
use linux-server,host-pnp ; Name of host templates to use
; This host definition will inherit all variables that are defined
; in (or inherited by) the linux-server host template definition.
host_name localhost
alias localhost
address 127.0.0.1
}
define service{
        use                     local-service,srv-pnp   ; Name of service template to use
        host_name               localhost
        service_description     PING
        check_command           check_ping!100.0,20%!500.0,60%
        }
The links to the correct URLs are created automagically.
Tips: if you want to open the PNP window in your main frame (on the right of the menu) instead of a new page, just set PopupsYou can integrate PNP into Nagios in a way that you have current graphs without clicking any icons. This can be accomplished using the CGI Includes which allow us to include JavaScript code in the status detail view ( status.cgi ). Prerequisites:
Definition:
define host {
   name       host-pnp
   action_url /pnp4nagios/index.php/graph?host=$HOSTNAME$&srv=_HOST_' class='tips' rel='/pnp4nagios/index.php/popup?host=$HOSTNAME$&srv=_HOST_
   register   0
}

define service {
   name       srv-pnp
   action_url /pnp4nagios/index.php/graph?host=$HOSTNAME$&srv=$SERVICEDESC$' class='tips' rel='/pnp4nagios/index.php/popup?host=$HOSTNAME$&srv=$SERVICEDESC$
   register   0
}
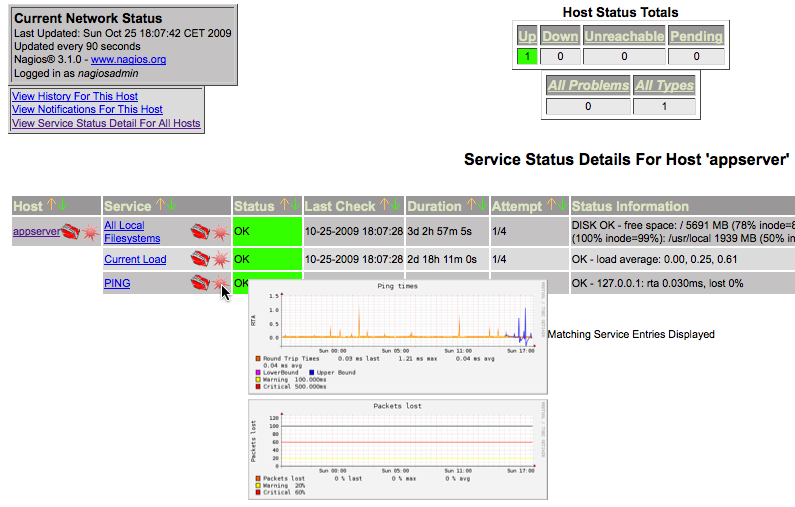
After a restart of Nagios (after modifying the definitions) the result might look like this: PNP Web Frontend
The behaviour of the PNP Web-Frontend can be controlled through the config file
Own adjustments should be made in etc/config.phpFollowing the most important parameters:
The path to the RRDtool binary. Will be detected by $conf['rrdtool'] = "/usr/bin/rrdtool"; Height and width of the RRD graphs $conf['graph_width'] = "500"; $conf['graph_height'] = "100"; Screen sizes may vary, pages sizes won't. The following two directives enable you to specify different sizes for the creation of PDFs. If they aren't specified the values of the graph sizes are taken. $conf['pdf_width'] = "675"; $conf['pdf_height'] = "100";
Additional options passed with every call of RRDTool, for example $conf['graph_opt'] = "";
The path to the RRD and XML files created by $conf['rrdbase'] = "/usr/local/pnp4nagios/var/perfdata/"; The path to the config file for the pages. $conf['page_dir'] = "/usr/local/pnp4nagios/etc/pages/"; PNP pages will be refreshed every n seconds $conf['refresh'] = "90"; Max. age of RRD files in seconds. After reaching this value links to the graphs will be marked as inactive $conf['max_age'] = 60*60*6; Base URL to the Nagios CGIs $conf['nagios_base'] = "/nagios/cgi-bin"; List of users who are allowed to view links to the services of the current host $conf['allowed_for_service_links'] = "EVERYONE"; List of users who can view/access the host search field $conf['allowed_for_host_search'] = "EVERYONE"; If PNP is called with a host only ( index.php?host=<myserver> ), the defined user is shown an overview of all services related to this host $conf['allowed_for_host_overview'] = "EVERYONE"; The periods of time the RRD graphs will show are determined using the array $views[]. The title and number of graphs can be specified globally in this place
$views[] = array('title' => 'One Hour',  'start' => (60*60) );
$views[] = array('title' => '4 Hours',   'start' => (60*60*4) );
$views[] = array('title' => '25 Hours',  'start' => (60*60*25) );
$views[] = array('title' => 'One Week',  'start' => (60*60*25*7) );
$views[] = array('title' => 'One Month', 'start' => (60*60*24*32) );
$views[] = array('title' => 'One Year',  'start' => (60*60*24*380) );
You can add more views ($views[5], …) but please keep in mind that under normal circumstances ALL views you defined are shown. TimerangesIn the overview PNP shows five timeranges which can be defined in config.php. Additionally you can influence the timeranges via the URL. This can be useful to automatically create PDF documents. The ranges can be defined using the options “start” and “end”. Example: pnp4nagios/graph?host=<hostname>&srv=<servicedesc>&start=-1week The graph will start one week prior to the current date and time. It will end at the current timestamp.
Examples of different specifications
Pages“pages” provide the opportunity to collect graphs of different hosts/services on one page. That way - as an example - you can display the traffic rates of all tape libraries. Regular expressions are possible so you can accomplish a lot with only few definitions - provided that you have appropriate names. The directory specified using “$conf['page_dir']” contains one or more file with the extension ”.cfg”.
Comments start with a hash-sign (#) and are possible within lines as well. Each file contains a “page” definition which specifies the name of the page and it determines whether the following graph definition contains regular expressions or not. define page {
use_regex 1 # 0 = use no regular expressions, 1 = use regular expressions
page_name test-page # page description
}
One or more “graph” definitions follow: define graph {
host_name host1,host2,host3
service_desc Current_Load
}
Attention: The list of host name will only work if you use define graph {
host_name host4
service_desc Current_Users
}
And now some definitions with regular expressions. At first all hosts whose names are starting with “Tape”: define graph {
host_name ^Tape
service_desc Traffic
}
all hosts whose names are ending with “00”: define graph {
host_name 00$
service_desc Load
}
all services of localhost whose names contain “a” or “o”, respectively: define graph {
host_name localhost
service_desc a|o
}
all services whose names contain an underscore followed by (at least) three digits on all hosts whose names start with “UX”: define graph {
host_name ^UX
service_desc _\d{3}
}
In some cases you may want to limit the display to just one graph. To accomplish this you can use the optional directive “source” followed by a number specifying the position within the RRD file starting at 0 define graph {
host_name host1,host2,host3
service_desc PING
source 1
}
Data export
PNP provides access to RRD data using the The controller can be called using the URL /pnp4nagios/xport/<format>?host=<hostname>&srv=<servicedesc> whereas <format> has to be replaced with the desired format.
You can also use wget -O image.png 'http://<user>:<pass>@<nagios-server>/pnp4nagios/image?host=<hostname>&srv=<service>&view=2&source=0'
Instead of What are templates?PNP uses templates to influence the appearance of RRD graphs. The selected check_command determines which template will be used to control the graph. Following will be described where templates are stored and how the decision for the “right” template is made. What template will be used when?Templates are stored at two places in the file system.
If the graph for the service “http” on host “localhost” should be shown, PNP will look for the XML file
<NAGIOS>
  <DATASOURCE>
    <TEMPLATE>check_http</TEMPLATE>
    <DS>1</DS>
    <NAME>time</NAME>
    <UNIT>s</UNIT>
    <ACT>0.006721</ACT>
    <WARN>1.000000</WARN>
    <CRIT>2.000000</CRIT>
    <MIN>0.000000</MIN>
    <MAX></MAX>
  </DATASOURCE>
  <DATASOURCE>
    <TEMPLATE>check_http</TEMPLATE>
    <DS>2</DS>
    <NAME>size</NAME>
    <UNIT>B</UNIT>
    <ACT>263</ACT>
    <WARN></WARN>
    <CRIT></CRIT>
    <MIN>0</MIN>
    <MAX></MAX>
  </DATASOURCE>
...
</NAGIOS>
PNP will append
The template default.php takes an exceptional position as it is used every time no other applicable template is found. Creating own templatesPNP templates are PHP files which are included during execution of PNP using the PHP function include(). This means that every PHP code in templates will be interpreted so manipulation of all values is possible. PNP template must have the following characteristics:
These two arrays are used to call If both arrays contain more than one set of data graphs will be created for every set. Inside the templates the data from the related XML files can be used. Using the relatively simple template response.php we will describe the most important options. <?php # $opt[1] = "--title \"Response Time For $hostname / $servicedesc\" "; # $def[1] = "DEF:var1=$RRDFILE[1]:$DS[1]:AVERAGE " ; $def[1] .= "AREA:var1#00FF00:\"Response Times \" " ; $def[1] .= "LINE1:var1#000000 " ; $def[1] .= "GPRINT:var1:LAST:\"%3.4lg %s$UNIT[1] LAST \" "; $def[1] .= "GPRINT:var1:MAX:\"%3.4lg %s$UNIT[1] MAX \" "; $def[1] .= "GPRINT:var1:AVERAGE:\"%3.4lg %s$UNIT[1] AVERAGE \" "; ?> Note: as the number (1) and the letter “L” look alike in this listing: the format ”%3.4lg” contains a small letter.
The three GPRINT lines build up the caption for the graph. The current values are formatted using the printf syntax. Available variables
Using the data collector In the first part of the XML file the performance data is stored in separate components. <NAGIOS> <DATASOURCE> <TEMPLATE>check_http</TEMPLATE> <DS>1</DS> <NAME>time</NAME> <UNIT>s</UNIT> <ACT>0.006721</ACT> <WARN>1.000000</WARN> <CRIT>2.000000</CRIT> <MIN>0.000000</MIN> <MAX></MAX> </DATASOURCE> .... </NAGIOS> The field <DS> designates the data source and is used to identify the data series of the RRD files and is the key of the following arrays as well.
The array The XML file contains other information. When process_perfdata.pl is used in default mode all available macros are at hand with the current values. For the benefit of readability the following lines show only an extract. <NAGIOS> ... <NAGIOS_SERVICENOTIFICATIONID>8418</NAGIOS_SERVICENOTIFICATIONID> <NAGIOS_SERVICENOTIFICATIONNUMBER>0</NAGIOS_SERVICENOTIFICATIONNUMBER> <NAGIOS_SERVICEOUTPUT>HTTP OK HTTP/1.1 200 OK - 10087 bytes in 0.125 seconds</NAGIOS_SERVICEOUTPUT> <NAGIOS_SERVICEPERCENTCHANGE>0.00</NAGIOS_SERVICEPERCENTCHANGE> <NAGIOS_SERVICEPERFDATA>time=0.124811s;;;0.000000 size=10087B;;;0</NAGIOS_SERVICEPERFDATA> <NAGIOS_SERVICEPERFDATAFILE></NAGIOS_SERVICEPERFDATAFILE> <NAGIOS_SERVICEPROBLEMID>0</NAGIOS_SERVICEPROBLEMID> <NAGIOS_SERVICESTATE>OK</NAGIOS_SERVICESTATE> <NAGIOS_SERVICESTATEID>0</NAGIOS_SERVICESTATEID> <NAGIOS_SERVICESTATETYPE>HARD</NAGIOS_SERVICESTATETYPE> <NAGIOS_SHORTDATETIME>27-12-2007 13:51:23</NAGIOS_SHORTDATETIME> ... </NAGIOS> The various XML fields can be used as variables in the PNP templates. Each field is available as a variable with the same name.
The value of the field Custom TemplatesAs already described under ”What are templates ?” the appearance of graphs depends on the check command used. There are situations where this behaviour must be overruled, for example when universal commands have been defined. PNP, especially process_perfdata.pl, will search for a config file (<check_command>;.cfg) in the etc/check_commands directory and read its contents (if available). The following options can be defined in it: CUSTOM_TEMPLATEOutgoing from the following example of a Nagios command-definition:
define command {
  command_name check_nrpe
  command_line $USER1$/check_nrpe -H $HOSTADDRESS$ -c $ARG1$ -a "$ARG2$"
}
This would lead to a call of the check_nrpe.php template even when the monitored host would use a completely different plugin which is called via NRPE. As our example command is called check_nrpe it will be searched for etc/check_commands/check_nrpe.cfg. During installation a sample config file with the extension .cfg-sample is copied to etc/check_commands. # check_command check_nrpe!load!-w 4,4,4 -c 5,5,5 # ________0__________| | | # ________1__________________| | # ________2__________________________| # CUSTOM_TEMPLATE = 1
This option has effect only during creation of the RRD database. DATATYPEThe option “DATATYPE” controls the datatype which is used during creation of the RRD database. Default is “GAUGE”. For consecutive values the type should be “COUNTER”. Plugin-developers should use the unit “c” for counters but this is not always the case. To set all datasources to COUNTER DATATYPE = COUNTER Setting datasources to different types DATATYPE = GAUGE,GAUGE,COUNTER,COUNTER More datatypes are explained in the RRDTool documentation found at rrdcreate. This option has effect only during creation of the RRD database. USE_MIN_ON_CREATE and USE_MAX_ON_CREATEIn a few situations it might be necessary to limit the values which are valid for RRDTool. RRD databases can be created with fixed minimum and maximum values. You will find further details at http://oss.oetiker.ch/rrdtool/doc/rrdcreate.en.html. Account for the maximum value taken from the performance data USE_MAX_ON_CREATE = 1 Account for the minimum value taken from the performance data USE_MIN_ON_CREATE = 1 This option has effect only during creation of the RRD database. RRD_STORAGE_TYPERRD_STORAGE_TYPE = SINGLE The option RRD_STORAGE_TYPE defines the kind of data storage. Possible values are MULTIPLE and SINGLE, respectively. SINGLE: A RRD database per service MULTIPLE: One or more RRD databases per service. Each datasource will be stored in a separate RRD database. ATTENTION: The data will not be migrated automatically! You will find a conversion script here. This option has effect only during creation of the RRD database. RRD_HEARTBEATStarting with PNP 0.6.1 RRD_HEARTBEAT = 305 After <RRD_HEARTBEAT> seconds RRDtool expects new data. More information at http://oss.oetiker.ch/rrdtool/doc/rrdcreate.en.html This option has effect only during creation of the RRD database. Hints on Template NamesIn most situations, one can easily get desired template names, by using suitable command object definitions. Consider the followng example:
define command {
  command_name check_by_ssh
  command_line /usr/bin/ssh $HOSTADDRESS$ $ARG1$
}
with commands like: … check_command check_by_ssh!/usr/lib/nagios/plugins/check_load -w 4,4,4 -c 5,5,5 … Even when using “CUSTOM_TEMPLATE = 1” one would end up in template names like “_usr_lib_nagios_plugins_check_load_-w_4,4,4_-c_5,5,5”, which is highly undesired, especially because of the parameters in it. Solution 1: Split parameters into separate $ARGn$ A simple solution is to use the following command object definition:
define command {
  command_name check_by_ssh
  command_line /usr/bin/ssh $HOSTADDRESS$ $ARG1$ $ARG2$
}
with commands like: … check_command check_by_ssh!/usr/lib/nagios/plugins/check_load!-w 4,4,4 -c 5,5,5 … (notice the additional “!”) This even works, when $ARG2$ is let empty. Of course one would still need to set “CUSTOM_TEMPLATE = 1”. Solution 2: Hide the remote executor inside the command object definition Another way is to “hide” the remote excutor in the respective command object definitions. Instead of defining:
define command {
  command_name check_by_ssh
  command_line /usr/bin/ssh $HOSTADDRESS$ $ARG1$ $ARG2$
}
one would define the following for every command to be remotely executed:
define command {
  command_name check_load_by_ssh
  command_line /usr/bin/ssh $HOSTADDRESS$ /usr/lib/nagios/plugins/check_load $ARG1$
}
with commands like: … check_load_by_ssh!-w 4,4,4 -c 5,5,5 … Of course one must not set “CUSTOM_TEMPLATE = 1” in this way. Which of above two solutions one follows is largely a matter of taste. Distributed SystemsIf Nagios is implemented as a distributed system you have to decide where PNP should be installed. From a technical view this question is not important. PNP can be installed on the slave(s) as well as on the master server. Or only on the master? If PNP is running on the master you have to make sure that data passed via send_nsca from the slave server(s) contains performance data. Often another check command is used on the master. To help PNP on the master to recognize which check command was used on the slave to collect the information process_perfdata.pl responds to an additional field at the end of the performance data. OK - 127.0.0.1: rta 2.687ms, lost 0% | rta=2.687ms;3000.000;5000.000;0; pl=0%;80;100;; [check_icmp] If PNP finds a string enclosed in brackets at the end of performance data it will be recognized as check command and will be used as PNP template. Nagios documentation related to this topic can be found here. The command used in the documentation can be adapted easily.
define command{
	command_name	submit_check_result
	command_line	/usr/local/nagios/libexec/eventhandlers/submit_check_result $HOSTNAME$ '$SERVICEDESC$' $SERVICESTATE$ '$SERVICEOUTPUT$'
	}
should be changed to
define command{
	command_name	submit_check_result
	command_line	/usr/local/nagios/libexec/eventhandlers/submit_check_result $HOSTNAME$ '$SERVICEDESC$' $SERVICESTATE$ '$SERVICEOUTPUT$ | $SERVICEPERFDATA$ [$SERVICECHECKCOMMAND$]'
	}
check_multi pluginThe plugin check_multi is one of the first plugins which uses new features of Nagios 3.x. Check_multi can execute multiple Nagios plugins but returns only results like a single service. The output of check_multi comprises of several lines to be able to display the amount of information. This results in some difficulties for PNP which has to extract the information of several plugins from the performance data. Together with Matthias Flacke, developer of check_multi, we have found a solution to assign the data to the appropriate plugins.
RRDtool Cache DaemonIn large installations sooner or later one will recognize that processing the performance data will result in a relatively high I/O load. RRDtool has to do very much disk updates but cannot use the disk cache in an optimal way. One improvement is made by collecting and sorting the data. It is more effective to write many updates to an RRD database in one block. The disk cache can be used more effectively that way. The current RRDtool ( SVN trunk 1550+ ) contains rrdcached which should improve exactly this situation. At this point I'd like to thank Florian octo Forster, Kevin Brintnall and Tobi Oetiker. The development of this daemon has been coordinated exemplary on the rrd-developers mailing list. Mode of operationThe rrdcached is working as a daemon in the background and opens a UNIX or TCP socket to wait for requests of rrdtool. Due to security reasons newer versions of rrdcached cannot use absolute paths for network access anymore so the only possible way are unix sockets. rrdcachedrrdcached recognizes some important options which are passed during startup. Option -l defines the socket the daemon will listen for update requests. The default TCP port will be 42217. -l unix:/path/to/rrdcached.sock -l /path/to/rrdcached.sock -l 127.0.0.1 -l 127.0.0.1:8888 Option -P specifies which commands are usable with the RRD data bases -P FLUSH,PENDING Option -s allows to change the group ownership of the unix socket -s nagios Option -m sets the permissions of the unix socket in the usual octal format -m 0660 Option -w specifies the interval (in seconds) the data will be written to disk. -w 1800 Option -z defines a maximum delay which will be used to spread the write cycles over a certain range [0-delay] to avoid parallel write accesses. The value of option -z must not be larger than -w. -z 1800 Option -p defines a PID file -p /var/run/rrdcached.pid Option -j defines the path to a journaling directory. All requests will be logged there so that they can be processed after a restart in case the daemon crashes. -j /var/cache/rrdcached These options may result in a call of rrdcached with the following parameters rrdcached -w 1800 -z 1800 -p /tmp/rrdcached.pid -j /tmp -s nagios -m 0660 -l unix:/tmp/rrdcached.sock rrdtoolRRDtool itself will be informed about the daemon using the option --daemon=<socket>. rrdtool --daemon=unix:/tmp/rrdcached.sock update ... Of course this has to correspond with the options of rrdcached! Integration into PNPBecause two components of PNP have to prepared for the use of rrdcached there are changes in two config files. 1. Adjustment of process_perfdata.cfg for the data collector process_perfdata.pl # EXPERIMENTAL rrdcached Support # Use only with rrdtool svn revision 1511+ # RRD_DAEMON_OPTS = unix:/var/run/rrdcached.sock 2. Adjustment of config_local.php (or config.php) for the web interface # # EXPERIMENTAL rrdcached Support # Use only with rrdtool svn revision 1511+ # # $conf['RRD_DAEMON_OPTS'] = 'unix:/tmp/rrdcached.sock'; $conf['RRD_DAEMON_OPTS'] = 'unix:/var/run/rrdcached.sock'; The sample files contain the relevant options. NPCD
NPCD (Nagios-Perfdata-C-Daemon) was written to provide an asynchronous mode to handle performance data with Introduction
In large nagios installations, your average check latency may increase to a non-acceptable high value. This means that Nagios should do a check at time If you tell the Nagios core that you want to process the performance data after every single check this is doing well for a certain amount of checks but above this limit you will run into latency problems.
To reduce the number of actions for each check you can use the Bulk Mode which gathers performance data for some time and then lets the
This move is a very fast action for the How it worksAs mentioned above the Nagios process has finished its work with moving the performance data file to a spool directory but this won't bring the data into the RRD files.
For this task you can start
After NPCD starts running it will build a list of filenames found in
Since the perfdata files in the spool dir are in the same format as for the 'normal' bulk mode NPCD should execute Advantages / DisadvantagesPro:
Con:
NPCD Config
You have to control NPCD with its own configuration file like the rolled out
Just rename it to /usr/local/pnp4nagios/bin/npcd -f /usr/local/pnp4nagios/etc/npcd.cfg or /usr/local/pnp4nagios/bin/npcd -d -f /usr/local/pnp4nagios/etc/npcd.cfg to run in Daemon Mode (background). Hint: If you decide to not rename the config file, it might be overwritten by a future update of PNP. npcd.cfg-sampleThese are the essential configuration directives for NPCD: # Privilege Options user = nagios group = nagios # Logging Options log_type = syslog log_file = /usr/local/pnp4nagios/var/npcd.log max_logfile_size = 10485760 log_level=0 # Processing Options perfdata_spool_dir = /usr/local/pnp4nagios/var/spool/ perfdata_file_run_cmd = /usr/local/pnp4nagios/libexec/process_perfdata.pl perfdata_file_run_cmd_args = -b # Thread Options npcd_max_threads=5 # greedy options use_load_threshold = 0 load_threshold = 10.0 # Process Options pid_file=/var/run/npcd.pid The directives
check_procs is an example for a plugin which doesn't deliver performance data: ./check_procs -a ndo2db -w 1: -c 0: PROCS OK: 2 processes with args 'ndo2db' This can be changed with the following wrapper script check_procs.sh #!/bin/bash
LINE=`/usr/local/nagios/libexec/check_procs $*`
RC=$?
COUNT=`echo $LINE | awk '{print $3}'`
PROCS=`expr $COUNT - 1`
LINE=`echo $LINE | sed "s/: $COUNT /: $PROCS /"`
echo $LINE \| procs=$PROCS
exit $RC
Now you'll get the number together with the required label ./check_procs.sh -a ndo2db -w 1: -c 0: PROCS OK: 2 processes with args 'ndo2db'| procs=2 2.6. Performance data Performance data is defined by Nagios as “everything after the | of the plugin output” - please refer to Nagios documentation for information on capturing this data to logfiles. However, it is the responsibility of the plugin writer to ensure the performance data is in a “Nagios plugins” format. This is the expected format: 'label'=value[UOM];[warn];[crit];[min];[max] Notes:
It is up to third party programs to convert the Nagios plugins performance data into graphs. Origin: https://www.monitoring-plugins.org/doc/guidelines.html#AEN200 |


| ||||||||||||||||||||||||||||||||||||||||||||||